2020 Food Project Impact Report
Learning Life is pleased to release the impact survey results of our 2020 international food culture project. The project, part of our flagship program, the Family Diplomacy Initiative (FDI), ran from April to December 2020, engaged over 60 people in 35+ nations across the world, and yielded considerable improvements in surveyed participants’ warmth toward foreign populations as well reductions in feelings of national superiority and discomfort with cultural differences. These results offer modest but promising counters to the resurgent nationalism and xenophobia in a number of nations worldwide as we move to expand FDI in 2021.
Context
Since August 2016, through FDI, Learning Life has engaged families in different countries in learning together online with an eye to democratizing diplomacy and developing a family form of citizen diplomacy for a more caring world. In August 2017, we completed a community photo project which engaged 24 participants from eight lower-income families in Washington DC, USA, San Salvador, El Salvador, Dakar, Senegal, and Jerash, Jordan. The family participants took photos of their respective communities to share and discuss online to learn about community differences and social change, culminating in an international photo album and a project report published in the professional journal, Childhood Education.
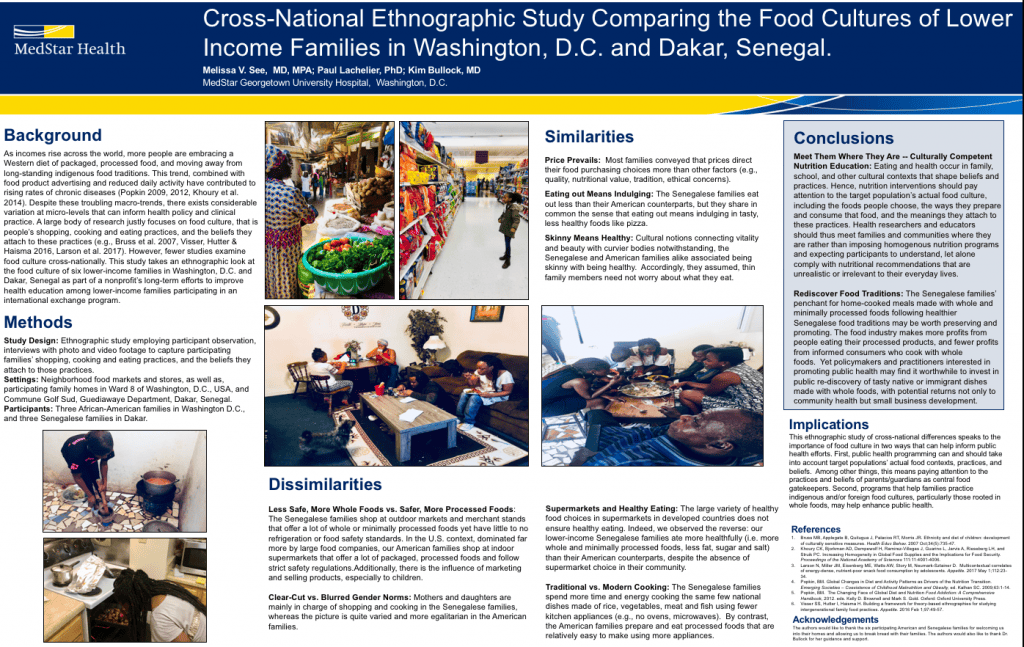
In 2018, Learning Life collaborated with the Georgetown University School of Medicine’s Community Health Division on two supplemental qualitative studies that compared the food culture of lower-income families in Washington DC, USA, San Salvador, El Salvador, and Dakar, Senegal. Those studies showed that richer is not necessarily better: while the Salvadorans and Senegalese families live in poorer countries, their diets tend to be healthier, containing more home-cooked meals made with whole foods (click here and here for details on these studies).
In October 2018 to May 2019, we carried out our second project, which, following on the above-mentioned 2018 studies, focused on improving participants’ knowledge of food culture and nutrition. In addition, participants answered questions about their interest in world affairs plus their tolerance for cultural differences and feelings of national superiority in the same survey completed before and after the project. Twenty-four participants from eight families in Washington DC, USA, San Salvador, El Salvador, and Dakar, Senegal, all with household annual income below their nation’s median, participated in the project. The project resulted in a 7% increase in participants’ interest in world affairs and engaging foreigners, a 9% decrease in nationalism and intolerance, and a 23% average improvement in their knowledge of food culture and nutrition*. Click here for the full project impact details.
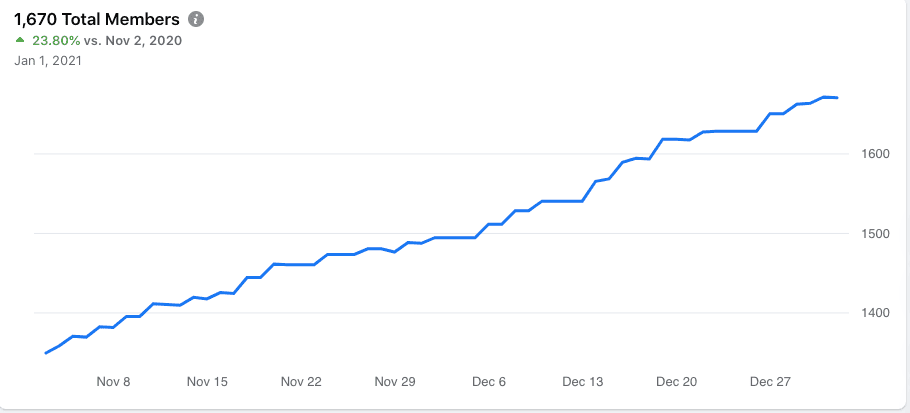
Starting in summer 2019, Learning Life began scaling up FDI on Facebook. By December 2020, we had doubled the number of members of our FDI Facebook Group from about 200 to 400+. By late August 2020 the group had doubled again to 800+, and by mid-December to 1,600. Not only has the pace of FDI growth thus accelerated, but the group has gone from majority American, to majority from other countries across the globe. As FDI grew in 2020, we launched a third, larger-scale project in April. The details and results of that project follow.
Project & Survey Details
In February this year, Learning Life announced our second food culture project. Food is vital to human life, interests many people worldwide, constitutes an accessible way to share and learn with others across lines of difference, and connects to culture, politics, economics, the environment and more in informative ways. We thus reasoned that exploring world “food culture” — that is, how people gather, prepare, eat food and dispose of food waste, and more precisely for our project this year, what families eat and the food culture they perceive in their country — would be a good topic for a scalable project fully implemented online through our FDI Facebook Group in 2020.
From April through October, we posted the following six questions to the Facebook Group, and invited Group members to answer, though we focused our efforts on a subset of recruited members who agreed to answer all six questions:
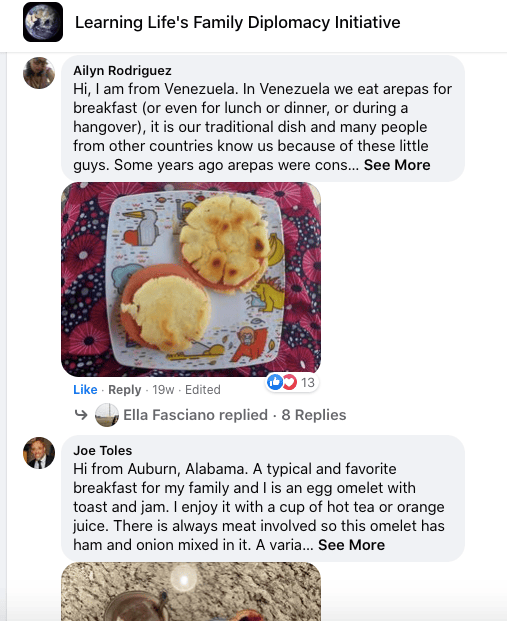
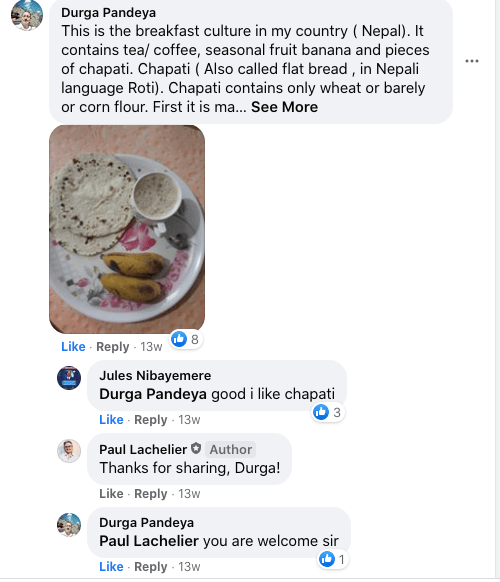
- April: What does a typical breakfast look like in your family?
- May: What does a typical dinner look like in your family?
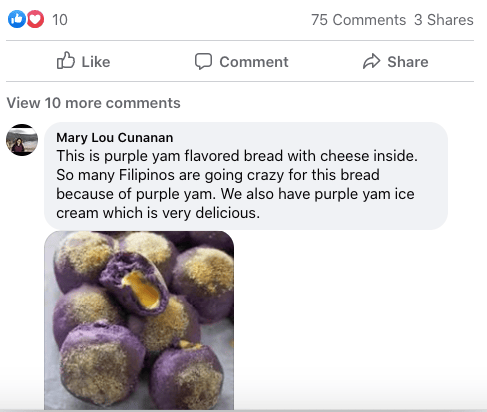
- July:What is a food trend happening in your country? A food trend is any new and popular food or way of eating.
- August: What is a “comfort food” (food that your family finds comforting to eat) that your family often eats?
- September: What is a food people eat in your country that you think foreigners may consider odd or unusual?
- October: What is a holiday your family celebrates, and what is a dish your family likes to make or buy for that holiday?
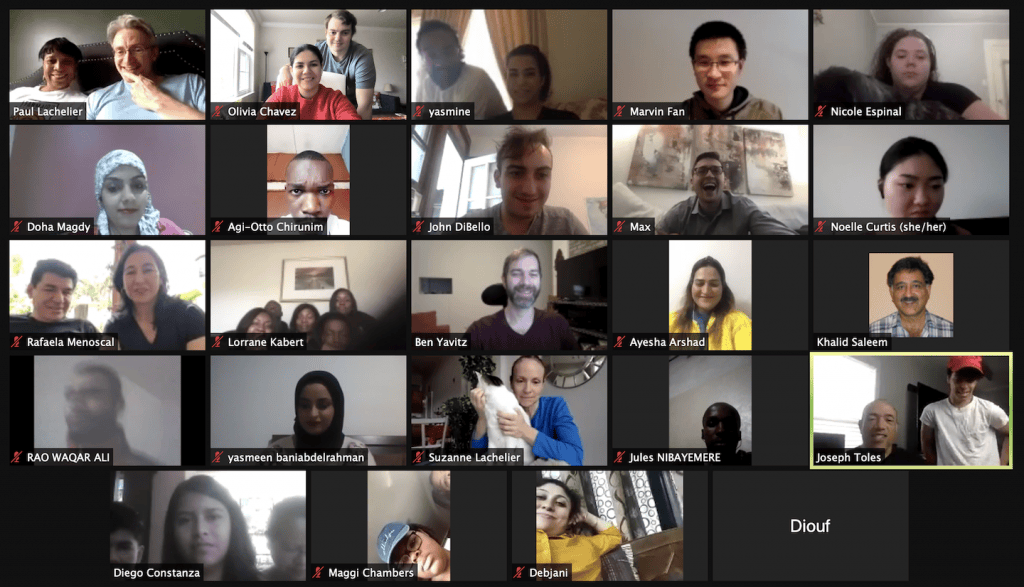
With each question, posted to the FDI Facebook group about 1.5 months apart, participants were asked to share one or more photos, plus text explanation of the ingredients in the food photos they presented. To encourage submissions, we allowed participants to upload internet photos if they did not have photos of their own, though preference was given to the latter. Participants were also able to read and engage with each other’s posts, commenting and asking questions, and some did just that. (We estimate about 20% engaged with fellow participants’ posts, though we did not do a precise count.) On November 15, we held a culminating live dialogue via Zoom with 22 participants and volunteers to discuss the project’s preliminary findings (click here for more about that dialogue, including photos and a video segment). A separate Learning Life report analyzing the participants’ food culture posts is forthcoming in January 2021.
To assess the project’s impact, trained Learning Life volunteers and interns endeavored to conduct a “pre-survey” and a “post-survey” with each of the participants before (pre) and after (post) they engaged in the project. Our pre- and post-surveys, conducted online via Facebook, Whatsapp or Zoom mostly in February-April and December, respectively, posed fifteen questions about respondent demographics and behavior (city, country, age, gender, marital status, family role, education, occupation, and frequency of contact with people in other countries), plus our factors or “dependent variables” of interest. While food was the vehicle for sharing and conversation, our focus in this impact study was not what participants learned about food culture worldwide, but rather a set of variables of central concern to FDI and to those who wish to promote international peace, understanding and cooperation: interest in world learning and citizen diplomacy, (lessened sense of) national superiority, comfort with cultural difference, and warmth toward foreign populations. The post-survey, in addition, asked respondents what they liked about Learning Life, think can be improved, and how interested they are in participating in future FDI activities.
About the Survey Participants
Starting in February, via Facebook, Linkedin, email and our own social networks, we invited 1,000+ diverse people by country and occupation to participate in the project. We identified 71 individuals in 37 nations who expressed interest in participating in the project. Of these 71, 66 completed the pre-survey. Of those 66, 22 failed to answer any of the questions, 8 answered one or more of the questions but did not complete the post-survey, and the rest – 36 – completed both the pre- and post-surveys. Those 36 respondents’ pre- and post-survey answers are compared below in aggregate. The other 30 who completed only the pre-survey are excluded in order to ensure an apples-to-apples comparison between the pre-survey and post-survey respondents.
Of the 36 individuals who completed both the pre- and post-survey, 25 responded to all six questions, 4 responded to five of the six questions, 1 responded to four questions, 3 to three questions, and 3 to two questions, for an average of 5.3 out of 6 questions answered per participant.
Demographics: At their pre-survey time, these 36 participants were mostly parents (20 of them) and older children (11), but there were also two grandparents, one aunt, and two who defined themselves as “other.” Twenty-three were women, thirteen men. In age, the youngest was 23, the oldest 74. Seven were in their 20s, 12 in their 30s, 10 in their 40s, 5 in their 50s, 1 in their 60s, 1 in their 70s, with the median age being 39. Eighteen were married, fifteen single, and three divorced. In terms of formal education, two were high school graduates, two had some university education but no degree, fourteen completed a bachelor’s or an equivalent university degree, sixteen a master’s or professional degree, and two a Ph.D. Their occupational status ranged from unemployed, school crossing guard, seamstress and chauffeur, to government executive staffer, school vice-principal, university professor, but nearly half (17) were in education, whether as students, teachers/professors, or administrators.
The 36 participants live in 25 countries worldwide. These countries, in alphabetic order, are: Australia (1), Belgium (1), Benin (1), Brazil (1), Burundi (1), Cameroon (1), Chile (1), China (2), Ecuador (2), Egypt (1), El Salvador (1), France (2), Haiti (1), India (1), Iran (1), Italy (1), Nepal (1), Pakistan (1), Palestine (1), Philippines (1), Senegal (2), Thailand (1), Turkey (1), United Arab Emirates (1), USA (8). Reflecting migration and globalization, it is worth noting that eight of the participants are not living in their native country, but answered the food culture questions with regard to their native country’s cuisine. Three of these eight are living in the USA but from China or Tunisia, one lives in Ecuador but is from Venezuela, one is in Belgium but from Ethiopia, one in Egypt from Jordan, one in Turkey from Pakistan, and one in UAE from Italy. Another one is an American living in Thailand, and in contrast with the eight others living abroad, focused his answers on his adopted country’s cuisine.
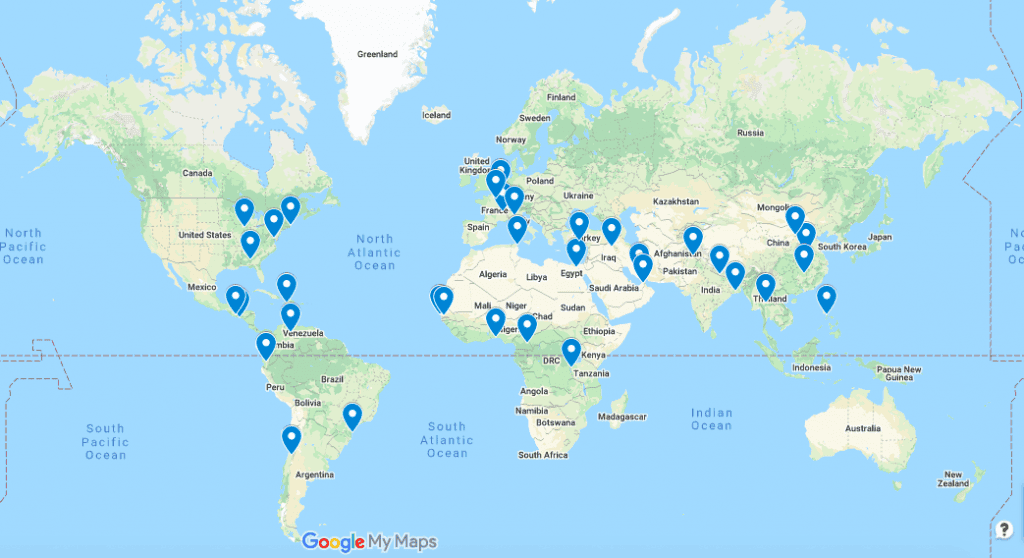
Where participants are located worldwide
About a dozen other people from other countries, including the USA, United Kingdom, North Macedonia, Nigeria and Egypt, participated in the project, answering one to six of the questions, and contributing to the food culture dialogue in our FDI Facebook Group, but were not surveyed since they joined too late or did not respond to our survey solicitations.
Engagement with world affairs and people abroad: In the pre-survey, most participants communicated often with people they knew abroad: nine every day, ten a few times per week, five every week, four every month, five 1-6 times per year, and three did not have any family, friends or acquaintances abroad. When asked how much they engaged with world affairs – consuming world news or talking about foreign affairs, participating in and donating to international groups or causes – respondents generally reported high engagement, especially in consuming and talking world affairs, less so in participating and donating. These high-engagement patterns held in the post-survey as well.
Thus, our 36 participants overall tilted female, high in education and engagement with world affairs and people abroad, and were diverse in age and country. Now that we have discussed the demographic and behavioral characteristics of our respondents, let us turn to the pre- and post-survey comparisons that help us assess the impact of the food culture project on our respondents.

Jeannot Diouf and members of his family in Dakar, Senegal
Survey Results: Interest in World Learning and Citizen Diplomacy
We asked participants to rate their interest in learning about foreign affairs and families, and engaging in citizen diplomacy as follows:
“On a scale from 1 to 10 (1 being least, 10 being most), how interested are you in the following”
- Pre: 9.14 / Post: 9.31 (+2%*) Learning about things outside your country
- Pre: 8.75 / Post: 8.75 (+0%) Learning about families in different countries
- Pre: 8.61 / Post: 8.72 (+1%) Engaging in citizen diplomacy, that is efforts to strengthen relations between countries through citizen-to-citizen dialogue and collaboration
Thus, respondents on average reported slightly more interest in the first and third in the post survey. The average for all three statements was 8.83 in the pre-survey versus 8.93 in the post-survey, representing a 1% average increase in interest overall. Clearly, participants self-selected into the project and were highly interested prior. The project did not change their interest. Indeed, as the project feedback section below will reveal, participants are generally eager to continue with FDI.

Survey Results: Discomfort with Difference & Feelings of National Superiority
We asked participants to respond to five statements, the first three measuring their comfort with those who are culturally different or foreign, the fourth and fifth gauging perception of their country’s superiority. Here are the results:
“Please indicate how much you agree or disagree with each statement below, on a scale from strongly disagree to strongly agree. There are no right or wrong answers. Just answer quickly the way you feel.”
- Pre: 2.19 / Post: 1.83 (-16%) “People who look and act differently from me make me uncomfortable.”
- Pre: 2.78 / Post: 2.47 (-11%) “I prefer to live in a community of people who are like me than people who are unlike me.”
- Pre: 1.81 / Post: 1.69 (-7%) “Foreigners who come to live in my country more often cause trouble than do good.”
- Pre: 2.89 / Post: 2.97 (+3) “My country is probably the best country on Earth.”
- Pre: 2.92 / Post: 2.8 (-4%) “Most people would be happier if they lived as we do in my country.”
Note that in this question, the lower the number, the more comfortable with difference and the less superior respondents feel about their country. Thus, on all but one of the five statements, respondents on average exhibited more comfort with difference, and less sense of national superiority in the post-survey. The overall average for all five statements was 2.52 in the pre-survey versus 2.35 in the post-survey, or a 7% decrease in feelings of national superiority and discomfort with cultural difference.
Survey Results: Warmth toward Foreign Groups
The following “feeling thermometer” question is intended to measure respondents’ extent of warm or cold feelings toward a variety of salient groups in the world. The percentages below are means/averages for all the respondents in the pre-survey versus the post-survey, with changes up or down recorded in raw number and percentages in parentheses. Those highlighted experienced warmth increases of 5% or more. (Note: There were 36 respondents to this question in the pre-survey, 35 in the post-survey.)
“For each of the following groups, please choose any number between 0 and 100 to describe how cold or warm you feel toward the group. 0 means you feel the coldest or least favorable to the group, 100 means you feel the warmest or most favorable to the group, and 50 means you feel neutral (nothing one way or the other) toward the group.”
- Pre: 74% / Post: 78% (+4 or 5%) People from your country
- Pre: 61% / Post: 59% (-2 or 3%) Russians
- Pre: 68% / Post: 73% (+5 or 7%) Europeans
- Pre: 62% / Post: 61% (-1 or 2%) Chinese
- Pre: 74% / Post: 77% (+3 or 4%) Americans
- Pre: 70% / Post: 68% (-2 or 3%) Refugees
- Pre: 72% / Post: 78% (+6 or 8%) Legal immigrants
- Pre: 53% / Post: 58% (+5 or 9%) Illegal immigrants
- Pre: 67% / Post: 69% (+2 or 3%) Muslims
- Pre: 71% / Post: 76% (+5 or 7%) Christians
- Pre: 63% / Post: 67% (+4 or 6%) Jews
- Pre: 80% / Post: 79% (-1 or 1%) All people on Earth
Overall, warmth scores for all twelve groups rose from 68 to 70, a 3% increase. For four of the above twelve social groups, respondents’ feelings grew colder, but by a relatively insignificant 3% or less. For the other eight groups, participants’ feelings grew warmer. Six groups – people from the participants’ own countries (+5%), Jews (+6%), Christians (+7%), Europeans (+7%), legal immigrants (+8%), and illegal or undocumented immigrants (+9%) – experienced the largest warmth increases. Further, the mean lowest score rose from 21 to 30, a 43% increase in warmth.
Participant Feedback
In the post-survey, we asked some additional questions to garner feedback on the project and Learning Life more generally. Here is what we found:
“How would you rate each of the following given these answer choices: (1) very bad, (2) bad, (3) fair, (4) good, or (5) excellent?”
- Learning Life staff: 4.75/5.00
- 2020 food culture project: 4.64/5.00
- The Family Diplomacy Facebook Group: 4.36/5.00
- Learning Life overall: 4.64/5.00
Thus, on average, respondents rated Learning Life highly, or 4.64 out of 5 overall. The next question addressed their interest in participating further:
“Overall, how interested are you in continuing to participate in the Family Diplomacy Initiative?”
- Definitely not interested: 0 (0%)
- Somewhat uninterested: 0 (0%)
- Neutral: 1 (3%)
- Somewhat interested: 6 (17%)
- Definitely interested: 29 (81%)
Thus, the large majority of respondents, 29 of 36 or 81%, were definitely interested in continuing with the Family Diplomacy Initiative. The next question asked more specifically about their interest in participating our 2021 project:
“In 2021, Learning Life will be holding a series of live, international dialogues focused on the question: what do families worldwide need to be healthy and safe? We will also be leading discussion on this question in the Family Diplomacy Initiative Facebook Group. How interested are you in participating in these discussions next year?”
- Definitely not interested: 0 (0%)
- Somewhat uninterested: 1 (3%)
- Neutral: 0 (0%)
- Somewhat interested: 7 (20%)
- Definitely interested: 27 (77%)
Thus, as with the prior question, the strong majority, 27 of 35 respondents or 77%, were definitely interested in participating in our 2021 dialogue project.
Discussion & What Comes Next
The year 2020 was difficult for many people across the world due to the Coronavirus Pandemic. Covid made this project both more challenging and easier. On one hand, some people had a lot more time and the luxury to be online due to the pandemic shutdown, and this may have boosted some participants’ contributions. On the other hand, Covid made many families suffer unemployment, plus distance, illness and/or death in their families, which understandably turned some of our participants away from this far less pressing project. In these difficult times, we are very appreciative of those who participated, and especially appreciative of those who answered all six food culture questions and/or engaged with fellow participants about their food posts.
The above impact survey results are generally encouraging, with the most significant gains being (a) a 7% decrease in participants’ feelings of national superiority and discomfort with cultural difference, and (b) a 5% to 9% increase in their warmth toward people from their own countries, Europeans, legal and illegal immigrants, Christians and Jews, and (c) a 43% increase in warmth in the coldest scores on the feeling thermometer. We believe that the food culture project at least partly explained these gains, but we cannot be sure of this because many other factors, like domestic and international social and political events as well as developments in participants’ own lives, may explain these gains. Given resource constraints, we were not able to conduct the “gold standard” in impact evaluation research – a formal experiment – which would have helped give us more confidence in our impact. Formal experiments compare otherwise similar “treatment” and “control” groups that respectively do and do not receive the treatment (in this case, our project) to more accurately isolate and measure treatment impact. In completing pre- and post-surveys, we were, however, able to go beyond the strictly post-survey method some organizations conduct, which does not allow comparison of respondents before and after project participation.
For a copy of all the survey numbers, please email us at email@learninglife.info.
What’s next? In 2020, Learning Life quadrupled the number of FDI Facebook Group members in 2020, from 400+ to 1,600+. In 2021, we plan to continue adding many more members across the globe on Facebook. In the latter half of 2021 we will also be launching a new project: a series of live dialogues focused on the question: what does it take to have safe, healthy families worldwide? We aim involve at least one hundred family diplomats worldwide in this new project, nearly triple the 36 involved in our 2020 project. There’s more, and you can learn here about what is planned for 2021, plus what else we accomplished in 2020. Thanks for reading, and for your support for Learning Life!
Acknowledgements
We would like to thank the many volunteers and interns who helped grow the FDI Facebook group and make this project possible, including Nima Majidi, Solana Gibson, Karmen Perry, Anna Hermann, Ariana Sierra-Chacon, Ishita Gupta, Estelle Brun, Diana Mubarak, Emma Bomfim, Hannah Trauberman, Samantha Giuntini, Shuwen Wang, Clara Geci, Angeline Fry, Allison Miller, Ella Fasciano, Alexia Vega, Maggi Chambers, Max Lieblich, Nikki Espinal, Noelle Curtis, Olivia Chavez and Yasmine Ezzekmi. Last but not least, thanks to Learning Life’s Founder and Director, Paul Lachelier, who led the project from design to implementation, research, write-up and dissemination. Our apologies if we missed anyone, and if we did, please let us know their name at email@learninglife.info so that we may acknowledge them here!
*All the percentages in this report are rounded to the nearest whole number.