This summer, Learning Life was lucky to have three student interns who contributed valuably to our work. This spotlight series will showcase each of our summer interns, starting this month with Kayla Hamedi.
It doesn’t take long to look at Kayla’s resume to realize she’s an achiever. Kayla, a Maryland resident, delivered the commencement address at her high school class’s graduation ceremony after graduating in the top 5% of her class, earning a number of awards (e.g., Maryland Distinguished Scholar Award Honorable Mention, National Society of High School Scholars Nominee, Scholar Athlete Award), and serving as Class of 2011 Second Vice President, the student newspaper’s Business Manager and News Editor, Persian Club President (her parents hail from Iran) and International Club Vice President, among other roles.
This fall semester, Kayla will be entering her junior year at George Washington University in Washington D.C., majoring in political science and minoring in development studies. At GW, Kayla has an impressive 3.75 GPA, and has been involved with The National Society of Collegiate Scholars, the College Democrats, and Students for Barack Obama. Upon graduating, Kayla aims to go to law school in order to pursue a career advocating for human rights internationally.
Just as Kayla’s resume signaled she’s an achiever, so did her work with Learning Life this summer. Cumulatively, Kayla:
1) Researched and wrote over a hundred facts on varied topics of importance, from identity theft to global warming, for dissemination via Learning Life’s social media outlets.
2) Compiled newspaper advertising rates to compare with Learning Life’s rates for designing, printing and distributing sponsored educational napkins, coasters and other surfaces in the DC metro area.
3) Gathered online opportunities for Learning Life to guest blog
4) Generated a list of selected businesses in Alexandria, VA for Learning Life to contact for possible partnership.
5) Helped increase Learning Life’s number of likes on Facebook and followers on Twitter.
6) Collected notable quotes about education and the importance of information to support Learning Life’s work.
In addition, one of the sometimes lesser appreciated but essential characteristics of any good intern or employee is punctual attendance, and Kayla’s attendance at staff meetings was consistent and punctual, even with a long commute from Maryland to Virginia, where Learning Life is based.
Outside Learning Life, Kayla has, among other things, assisted local food banks in distributing boxes of food to local homeless shelters, tutored students in a variety of subjects, helped re-elect Barack Obama, and most recently joined Homeward Trails Animal Rescue to help find homes for stray, abandoned and rescued dogs and cats.
Asked why she chose to intern with Learning Life, Kayla said, “I feel Learning Life’s work can really make a difference in the way of educating outside of a school environment. The more well-informed our society is, the better we become as a whole, and to be a part of something that promotes that is an honor.”
Thanks, Kayla! We look forward to keeping in touch with you, and seeing you occasionally at Learning Life volunteer events!
To learn more about interning or volunteering with Learning Life and other ways you can help, contact us at email@learninglife.info.
Humans are Inertial, Social Creatures: Social Science for Incidental Learning
Learning Life tackles a new frontier of public education. Rather than focus on schools, we seek to nurture a wider public culture of learning by spreading knowledge on the surfaces of everyday life. This approach is rooted in the realities that learning happens everywhere and throughout life, not just at school in one’s youth, and often incidentally not just deliberately. (For more on this, read Learning Life’s credo here, and a blog post on incidental learning here.)
Learning Life’s incidental learning approach is based on insights from social science. Social science research offers interesting and sometimes surprising insights into human behavior that matter for education. Here are two important social science insights that help explain the reasoning behind our approach.
Humans are inertial
Call it efficient, lazy, or else, the fact is human beings tend toward inertia: we like to stay put or do the same thing. This means it’s often difficult to get people to change, or make special efforts. This is not necessarily a bad thing since change can lead to bad outcomes. Further, as scholars Richard Thaler and Cass Sunstein note in their insightful book, Nudge (2009), inertia can be nudged to beneficial purpose when we start with good decisions. Thaler and Sunstein raise retirement savings as an example: when the default option employers give to new employees is to reserve a portion of their paycheck for retirement, inertia leads many more workers to start and continue saving for retirement than do so when they otherwise have to elect or opt in to saving.
A parallel can be drawn to education. Educators traditionally expect students to come to school and make deliberate efforts to learn. Effort is of course necessary to learn. But increasingly, one does not have to go to school to learn. More and more universities now offer distance learning and MOOCs (massive open online courses) so students can pursue their education at home or on the go, and at lower cost or free to boot. Going a step further, Learning Life makes it easier for inertial human beings to learn in everyday life by placing free opportunities to learn in their everyday settings, on napkins in restaurants, coasters in bars, cup sleeves in cafes, cereal boxes at home, etc., then connecting these educational surfaces to more information and quizzes at Learning Life online.
The point is this: given human inertia, it is easier to get people to learn when learning materials are free, readily available, brief and inviting, not just locked up in increasingly expensive schools.
Humans are social
Much social science research confirms that human beings are social creatures. That is, we not only are interested in what other human beings are doing, we also like to follow and conform to our fellows and people we look up to. This is true even of “ruggedly individualistic” Americans. Thus, social scientists have found people remarkably inclined to follow peers even when they’re obviously wrong (Asch 1995), to follow orders even when the order is to kill or torture (Milgram 1974, Zimbardo 2007), to get pregnant when peers are getting pregnant (Akerloff, Yelen & Katz 1996), to get grades similar to those of college roommates (Sacerdote 2001), to get fat when friends are fattening (Christakis & Fowler 2007), to vote when told others will find out if one voted or not (Gerber, Green & Larimer 2008), etc.
This basic social science finding that humans are social creatures leads organizations to, among other things, get experts and celebrities to endorse their brand, products and services, make social proof claims like “fastest growing” or “bestselling,” and more recently, use online social networks like Facebook to let you know that your friends, family and acquaintances like them (Cialdini 2001).
There are legitimate debates about the proper use of social science to influence people, but if learning is a virtue we want to encourage more people to engage in, it makes sense to apply social science insights to nurture public education. In this case, knowing that humans are social creatures suggests that educational organizations could use social situations to stimulate more learning. By printing invitations to learning (e.g., stimulating facts plus quiz questions, a puzzle, or riddle about health, history, science or other topic, leading to Learning Life for answers, further learning, fun and reward) on napkins, coasters, cup sleeves, placemats and other surfaces in common social settings, like restaurants, cafeterias, cafes and bars, these invitations can lead to learning and informative discussions among friends, family and acquaintances that might not otherwise occur.
Social science doesn’t just belong in school. To the extent that social science helps us better understand ourselves and our world, we can and should use and spread its insights to improve ourselves and the world. Given education’s importance in our complex, intertwined modern world, applying social science insights to improve and extend public education is arguably paramount, and that’s precisely Learning Life’s priority.
Akerloff, George A., Janet L. Yellen, and Michael L. Katz. 1996. “An Analysis of Out-of-Wedlock Childbearing in the United States.” Quarterly Journal of Economics 111:277-317.
Asch, Solomon. 1995. “Opinions and Social Pressure” in Readings about the Social Animal, ed., Elliott Aronson. New York: W.H. Freeman.
Christakis, Nicholas A., and James H. Fowler. 2007. “The Spread of Obesity in a Large Social Network over 32 Years.” New England Journal of Medicine 357:370-379.
Cialdini, Robert B. 2001. Influence: Science and Practice. Needham Heights, MA: Allyn & Bacon.
Gerber, Alan S., Donald P. Green, and Christopher W. Larimer. 2008. “Social Pressure and Voter Turnout: Evidence from a Large-Scale Field Experiment.” American Political Science Review 102:1:33-48.
Milgram, Stanley. 1974. Obedience to Authority. New York: HarperCollins.
Sacerdote, Bruce. 2001. “Peer Effects with Random Assignment: Results for Dartmouth Roommates.” Quarterly Journal of Economics 116:681-704.
Thaler, Richard H., and Cass R. Sunstein. 2009. Nudge: Improving Decisions about Health, Wealth, and Happiness. New York: Penguin Books.
Zimbardo, Philip. 2007. The Lucifer Effect: Understanding How Good People Turn Evil. New York: Random House.
Significant Facts on Everything from Climate Change…to Shopping Behavior
Learning Life’s mission is to nurture a wider culture of learning by spreading knowledge on the surfaces of everyday life. To help advance our mission, we post brief, interesting and significant facts (as opposed to trivial information) to our social media outlets, including Facebook, Linkedin, Twitter and Pinterest. Here is a sampling of some of the information we have disseminated thus far on everything from climate change, to the U.S. Constitution, to research on shopping behavior.
Thanks to Learning Life interns Kayla Hamediand Anjali Jacob for researching and drafting many of the following facts.
TABLE OF CONTENTS:
ANATOMY & PHYSIOLOGY
CONSUMPTION
Shopping Research
Energy & Fuel
Food & Nutrition
CRIME & CRIMINAL JUSTICE
EDUCATION, EMPLOYMENT, INCOME & SPENDING
ENVIRONMENT
Climate Change
Geography & Resources
Renewable Energy
Space Research
HEALTH & SAFETY
MEDIA
News Coverage
SCIENCE & TECHNOLOGY
SOCIAL ISSUES
Gender Issues
Human Rights
Poverty
Race & Racism
Sex & Marriage
Slavery
Suicide
Torture & Repression
Youth Issues
U.S. GOVERNMENT
Congress
Constitution
Elections & Parties
Internal Revenue Service
Presidents
Senate
Supreme Court
WAR & MILITARY
Veterans
ANATOMY & PHYSIOLOGY
Human Muscles of the Eye
According to the Library of Congress Science Reference Service, the external muscles of the eye, responsible for adjusting the position of the eye in order to maintain a steady fixation point, are some of the strongest muscles in the human body given their repetitive motion. In just one hour of reading, the eyes make almost 10,000 coordinated movements. Learn more about humans’ strongest muscles: http://www.loc.gov/rr/scitech/mysteries/muscles.html
CONSUMPTION – SHOPPING RESEARCH
Shoppers’ Eye Range
According to consumer researcher Paco Underhill, in his bestelling book, Why We Buy, the dictum “location, location, location” applies not just to where stores are located, but also to where goods are placed on shelves within stores. Because people’s eyes move within a certain predictable range, from slightly above eye level down to about knee level, stores often put the smallest and most important or profitable goods on store shelves in that eye range, and the largest or least profitable goods on shelves above or below that range.
Americans, on average, consumed 308 million British thermal units (a BTU is the amount of energy needed to heat one pound of water by one degree Fahrenheit) per person in 2009. There are, however, wide variations by state, with the least energy-consuming states clustered on the east and west coasts, and the greatest consumers among the Mountain and Plains states. Learn more here: http://energy.gov/maps/2009-energy-consumption-person
People who use smaller plates and bowls tend to eat less because the same portion sizes look bigger on/in smaller plates/bowls.
This interesting finding comes from Cornell University Professor Brian Wansink’s Food and Brand Lab. Learn more about the Lab’s eating behavior research by taking Learning Life’s five-question food psychology quiz at: http://letlearninglive.org/quiz/food-psychology/
Food Waste in America
Since the 1970’s, food waste has risen 50 percent in the United States. The U.S. Department of Agriculture estimates that between 30 and 40 percent of the U.S. food supply is thrown away, amounting to 1,400 calories per person per day, $400 per person per year, and 31 million tons of food added to landfills each year. For more information and to help the USDA reduce food waste, visit the US Food Waste Challenge: http://www.usda.gov/oce/foodwaste/index.htm.
According to the U.S. Centers for Disease Control and Prevention, from 2003–2006 to 2007–2010 the percentage of daily calories consumed from fast foods among adults less than 20 years old decreased slightly from 12.8% to 11.3%. For those aged 40-59, a decrease from 12.7% to 10.5% was observed. Those 20-39 years old ate the most fast food. Learn more about your world at Learning Life: http://letlearninglive.org/.
Did you know that about 60% of the adult body is composed of water? In fact, the brain and heart are composed of 73% water, the lungs 83%, the skin 64%, and the bones 31%. Learn more about the water in you: http://ga.water.usgs.gov/edu/propertyyou.html
CRIME & CRIMINAL JUSTICE
Firearm Violence and Homicide
According to the U.S. Bureau of Justice Statistics, of all homicides committed between 1993 and 2011, 70% were due to firearms violence. Learn more here: http://www.bjs.gov/index.cfm?ty=pbdetail&iid=4616
Household Burglaries
According to the U.S. Bureau of Justice Statistics, the rate of household burglaries decreased by 56% from 63 victimizations per 1,000 U.S. households to 27 from 1994 to 2011. However, theft involving electronic devices increased from 28% to 34% from 2001 to 2011.
Is education worth the investment? One way to answer this question is to look at income by education level. According to the U.S. Bureau of Labor Statistics, here were the average weekly earnings of persons 25 and older working full-time in 2012, by education level:
Doctoral degree: $1,624
Professional degree: $1,725
Master’s degree: $1,300
Bachelor’s degree: $1,066
Associate’s degree: $785
Some college, no degree: $727
High school degree: $652
Less than high school: $471
Education and Employment
Is education worth the investment? One way to answer this question is to look at unemployment rates by education level. According to the U.S. Bureau of Labor Statistics, here was the unemployment rate in 2012 for persons 25 and older, by education level:
According to the National Center for Education Statistics, “Of the 1,650,000 bachelor’s degrees conferred in 2009-2010, the greatest numbers of degrees were conferred in the fields of business (358,000); social sciences and history (173,000); health professions and related programs (130,000); and education (101,000).” Additionally, the number of bachelor’s degrees conferred rose 33% between 1999-2000 and 2009-2010. For more info, visit: http://nces.ed.gov/fastfacts/display.asp?id=37
Education, Employment & Gender
Men are more likely than women to have a job, even with the same education level, according to the National Center for Educational Statistics. In 2012, the employment rate for young adults 20-24 years old with less than a high school degree was 57% for males and 36% for females. The rate for young adults with a high school degree was 68% for males and 59% for females, and 89% versus 86% respectively for men and women with a college degree or higher. As the level of education increases, the gender difference in employment rates diminishes. For more, visit: http://nces.ed.gov/programs/coe/indicator_tba.asp
Dropout Rate
According to the U.S. Department of Education, the high school dropout rate nationwide has decreased from 12% in 1990 to 7% in 2010. The most significant drop was seen amongst Hispanics, which declined from 32% to 15%. Learn more about your world at Learning Life: http://letlearninglive.org/
Studies show that young children’s cognitive skills are hindered by poverty much more than race/ethnicity. The Early Childhood Longitudinal Study, for instance, found that 29% of 2-year-olds in poverty showed proficiency in listening comprehension versus 67% of 2-year-olds at or above poverty. In contrast, minimal differences were found among racial/ethnic groups. Learn more about your world at Learning Life: http://letlearninglive.org/.
According to the National Oceanic and Atmospheric Administration (NOAA), over the last century, the global average temperature has increased by more than 1.4 degrees Fahrenheit. The decade from 2000 to 2010 was the warmest on record, and 2010 was tied with 2005 as the warmest year on record.
Are very snowy winters a sign that global warming is not happening? No. According to the U.S. Environmental Protection Agency, very snowy winters are more likely in a warmer climate because warmer temperatures mean more water vapor is held in the atmosphere, causing more intense rain and snowstorms. As the climate warms, snow seasons are expected to shorten, but may nonetheless entail bigger snowstorms.
Nearly 70% of the Earth’s surface is covered in water. Of that, 97% is ocean water. Only 3% is freshwater. Take Learning Life’s water quiz to learn more: http://letlearninglive.org/quiz/water-facts/
ENVIRONMENT – RENEWABLE ENERGY
Deserts and Solar Energy
According to the U.S. Energy Information Administration, covering 4% of the world’s deserts with photovoltaic/solar energy panels could supply all of the world’s current electricity needs. Take this Learning Life five-question quiz to learn more about energy:
In 2003, NASA launched the twin rovers “Spirit” and “Opportunity” as part of their Mars Exploration Rover Project. After working twenty months in a Mars area called “Cape York,” the Opportunity rover has confirmed that the planet was once rich with water. According to astronomers, there was once a large amount of water flowing, all of which was drinkable. For more info, visit: http://www.nasa.gov/mission_pages/mer/news/mer20130607.html
HEALTH & SAFETY
Leading Killers Worldwide
According to the World Health Organization, the leading killers worldwide are high blood pressure (13% of global deaths), tobacco use (9%), high blood sugar (6%), physical inactivity (6%), and overweight and obesity (5%).
Learn more from the World Health Organization’s (WHO) 2009 “Global Health Risks” report:
According to the Centers for Disease Control and Prevention, African American men die on average six years sooner than white men (70 vs. 76 years), and African American women die 4 years sooner than white women (77 vs. 81 years). Learn more about your world at Learning Life: http://letlearninglive.org/.
4,609 workers were killed on the job in the United States in 2011, according to the Occupational Safety and Health Administration (OSHA). That’s nearly 13 deaths every day.
This, per OSHA, is a slight rise from the 4,551 workplace deaths in 2009, but the second lowest annual total since 1992, when the first workplace death census was conducted. The leading type of workplace death in 2011 was transportation incidents (especially on roadways), accounting for 41% of the year’s 4,609 deaths.
The National Highway Traffic Safety Administration reports that “at any given daylight moment across America, approximately 660,000 drivers are using cell phones or manipulating electronic devices while driving,” despite numerous warnings against this. This number has held steady since 2010. In 2011, more than 3,300 people were killed and 387,000 were injured in crashes involving a distracted driver. Learn more: http://www.dot.gov/briefing-room/nhtsa-survey-finds-660000-drivers-using-cell-phones-or-manipulating-electronic-devices
MEDIA – NEWS
News Coverage of Presidential Candidates
In 2012, the Pew Research Center examined the portrayal of presidential candidates in 50 major news outlets. In the 2012 presidential race, they found that 72% of news coverage was negative for Barack Obama compared with 71% for Mitt Romney, consistent with a trend toward negative news coverage in recent times. However, coverage of Barack Obama in 2008 diverged from this trend, with 69% of media coverage being positive, compared with 43% for John McCain.
In 2012, IBM announced that it had used the Blue Gene/Q Sequoia supercomputer to clock in over 16 quadrillion calculations per second. It currently ranks as the second fastest supercomputer in the world. Though not as fast, the brain is capable of doing more calculations per second than even the fastest supercomputer because it contains numerous networks of neurons that work simultaneously to solve many problems at once. For more info, visit: http://www.nsf.gov/discoveries/disc_summ.jsp?cntn_id=127617&org=NSF
The Manhattan Project
The Manhattan Project was a covert, government research project that produced the first atomic bombs. The project helped bring an end to World War II with the dropping of “Little Boy” and “Fat Man” on Hiroshima and Nagasaki, respectively. However, the atomic bomb also ushered in the nuclear age, and the Cold War between the U.S. and the U.S.S.R. Learn more: http://hss.energy.gov/healthsafety/ohre/roadmap/achre/intro_3.html
SOCIAL ISSUES – GENDER ISSUES
Sexual Violence in the United States
According to the Centers for Disease Control and Prevention’s (CDC) National Intimate Partner and Sexual Violence Survey (NISVS), “nearly 1 in 5 women and 1 in 71 men in the United States have been raped at some time in their lives and nearly 1 in 2 women and 1 in 5 men have experienced other forms of sexual violence victimization in their lifetime.” Learn more here: http://www.cdc.gov/violenceprevention/rpe/index.html
Sexual Violence in America
From 1995 to 2010, the “estimated annual rate of female rape or sexual assault victimizations” fell 58%, per the U.S. Bureau of Justice Statistics. Women 34 or younger who live in lower-income households in rural areas experience some of the highest rates of sexual violence. In 2005-2010, 78% of sexual violence involved an offender who was a family member, intimate partner, friend, or acquaintance. For more info, visit: http://www.bjs.gov/index.cfm?ty=pbdetail&iid=4594
Gender & Exhaustion
According to the Centers for Disease Control & Prevention, women (15%) were more likely than men (10%) to often feel very tired or exhausted. Among adults 18-44 years old, women were nearly twice as likely as men to feel this way (16% vs. 9%). For more info, visit: http://www.cdc.gov/mmwr/preview/mmwrhtml/mm6214a5.htm
The ICC, established in 2002, was formed to investigate and prosecute genocides, crimes against humanity and war crimes when national authorities are unable or unwilling to do so. Since its establishment, the ICC’s prosecutor has launched investigations into crimes committed in Uganda, the Democratic Republic of Congo, Sudan, and the Central African Republic.
It’s expensive to be poor. Per Brookings Institution researcher Matt Fellowes, “lower income families tend to pay more for the exact same consumer product than families with higher incomes. For instance, 4.2 million lower income homeowners that earn less than $30,000 a year pay higher than average prices for their mortgages. About 4.5 million lower income households pay higher than average prices for auto loans. At least 1.6 million lower income adults pay excessive fees for furniture, appliances, and electronics. And, countless more pay high prices for other necessities, such as basic financial services, groceries, and insurance. Together, these extra costs add up to hundreds, sometimes thousands, of dollars unnecessarily spent by lower income families every year.” Learn more: http://www.brookings.edu/research/reports/2006/07/poverty-fellowes
SOCIAL ISSUES — RACE & RACISM
Interracial Marriage
State laws prohibiting interracial marriage were valid in the United States until 1967. In 1967, in the famous Loving v. Virginia case, the U.S. Supreme Court unanimously declared such anti-miscegenation laws unconstitutional.In the Lovings’ case, Virginia had previously sentenced Mildred Loving, a black woman, and Richard Loving, a white man, to a year in prison for violating the state’s 1924 “Racial Integrity Act.”
In January 2003, a University of Maryland study concluded that race and geography are major factors in death penalty decisions. Specifically, black offenders who killed blacks were significantly less likely to face the death penalty, while black offenders who killed whites were significantly more likely to face a death sentence than all other racial combinations.
In 1940, 55% of U.S men and 68% of U.S. women aged 20-34 were married. By 2010, 30% of men and 39% of women the same age were married. Learn more about the U.S. in 1940 vs. 2010: http://www.census.gov/1940census/then_and_now/
SOCIAL ISSUES – SLAVERY
Slavery in the Modern World
Has slavery been abolished in the modern world? Not quite.
As of 2012, the U.S. State Department estimates as many as 27 million people around the world are victims of modern slavery, also known as trafficking in persons. Yet some progress has been made: according to the State Department’s 2012 Trafficking in Persons Report, 29 countries have made improvements in their efforts to prevent and combat modern slavery. For more from this report, visit: http://www.state.gov/j/tip/rls/tiprpt/2012/index.htm.
SOCIAL ISSUES – SUICIDE
Suicide in the USA
According to the U.S. Dept of Health & Human Services, “[s]uicide is the 10th leading cause of death in the United States. It accounts for the loss of more than 38,000 American lives each year, more than double the number of lives lost to homicide.” Learn more about suicide and mental health here: http://www.mentalhealth.gov/basics/myths-facts/index.html
SOCIAL ISSUES – TORTURE & REPRESSION
Torture and Repression in the World
In 2012, Amnesty International conducted research on human rights abuses in 159 countries and territories globally. Out of those 159 nations, 112 tortured their citizens, and 101 repressed their freedom of expression. Learn more about your world at Learning Life: http://letlearninglive.org/.
SOCIAL ISSUES – YOUTH ISSUES
Sibling Bullying
Being picked on by your brother or sister may seem like a normal part of growing up, but research shows it increases the risk of depression and anxiety. As University of New Hamphshire researcher Corinna Jenkins Tucker and her colleagues report in a 2013 study published in the journal, Pediatrics, among 3,600 U.S. kids surveyed, those who were pushed around by a sibling, physically or verbally, had higher depression and anxiety scores. They researchers suggest that parents should not turn a blind eye to their kids’ fights and teasing as it may prove harmful.
Did you know that the U.S. government was not always centered in Washington D.C.? Congress first met in the Capitol Building on November 17, 1800. Prior, meetings were held in Philadelphia, Pennsylvania. Learn more about the U.S. government at: http://www.aoc.gov/capitol-hill
The U.S. Constitution has 27 amendments, but only 26 of them are in force. Why is that?
Answer: In 1920, the long-standing and vigorous American temperance movement had its day. In that year, the United States ratified the 18th Amendment banning “the manufacture, sale, or transportation of intoxicating liquors.” Alcohol consumption subsequently fell by about half in the 1920s, but the 18th Amendment also spurred organized crime and corruption as the law was frequently broken. The 21st Amendment ratified in 1933 repealed the 18th Amendment, making it the only defunct amendment to the U.S. Constitution.
Did you know that the Democratic and Republican Party animal symbols arose out of mockery? During the 1828 election, Andrew Jackson’s opponents referred to him as a “jackass.” In response, he gleefully adopted the image for his Democratic Party campaign. Similarly, in 1874 the satirical cartoonist Thomas Nast drew an elephant scared of a donkey cloaked in lion’s skin, and labeled the elephant “the Republican vote.” The elephant has stuck with the Republican Party since. Learn more: http://kolkata.usconsulate.gov/uploads/images/vEZVrd1zUVX9pwzBU-hLxQ/Bulletin_May08.pdf
Super PACs
Everyone hears about Super PACs in election seasons, but what exactly are they?
A “Super PAC” is a Political Action Committee that cannot officially be affiliated with a candidate or party, or donate directly to them, but importantly, can otherwise spend unlimited amounts to influence election races. Super PACs’ right to spend unlimited amounts is due in part to the U.S. Supreme Court’s 2010 decision in Citizens United v. Federal Election Commission. Currently, there are 726 Super PACs. Learn more about your world at Learning Life: http://letlearninglive.org/.
The origins of the IRS date back to 1862 during the Civil War, when President Lincoln and Congress created the position of Commissioner of Internal Revenue and enacted an income tax to cover war costs. The constitutionality of the IRS came into question numerous times in the following years. However, this was legally resolved in 1913 with the addition of the 16th Amendment to the Constitution, which states, “Congress shall have power to lay and collect taxes on incomes, from whatever source derived, without apportionment among the several States, and without regard to any census or enumeration.”
In his second inaugural ceremony in 1793, President George Washington gave the shortest address in the ceremony’s history. The speech was only 135 words. Learn more inaugural history: http://www.inaugural.senate.gov/about/facts-and-firsts
Presidential Inauguration: Barack Obama
Not only did President Barack Obama’s first inaugural ceremony on January 20, 2009 have the largest attendance of any Presidential Inauguration in U.S. history, it had the largest attendance of any event in the history of Washington D.C. Learn more about U.S. presidents’ inaugural firsts: http://www.inaugural.senate.gov/about/facts-and-firsts
Attempted Assassination of Theodore Roosevelt
While on his way to making a campaign speech in Milwaukee in 1912, Theodore Roosevelt was shot at point-blank range by John F. Schrank. Roosevelt coughed into his hand, saw no blood, and thus assessed that the bullet had not entered his lung, so he proceeded to deliver his ninety-minute speech before visiting a doctor. Learn more about this incident: http://www.nps.gov/thrb/historyculture/whoshottr.htm
U.S. GOVERNMENT – SENATE
The Filibuster
Per the U.S. Senate website, a filibuster refers to “any attempt to block or delay Senate action on a bill or other matter by debating it at length, by offering numerous procedural motions, or by any other delaying or obstructive actions.” South Carolina Senator J. Strom Thurmond led the longest filibuster in U.S. history, speaking for 24 hours and 18 minutes to block the Civil Rights Act of 1957. Learn more about the history of the filibuster: http://www.senate.gov/artandhistory/history/common/briefing/Filibuster_Cloture.htm
The U.S. Supreme Court’s work begins on the first Monday in October, and runs through late June or early July. The term is divided between “sittings” for the hearing of cases and delivering of opinions, and intervening “recesses” for the consideration of the business before the Court and writing of opinions/decisions on cases. Sittings and recesses alternate every two weeks or so. This term, the Court will be deciding 32 cases between June and July, so be on the lookout for some landmark decisions!
As of 2012, there were 22.3 million U.S. veterans, 10% of whom were women, per the U.S. Department of Veterans Affairs. By 2040, the percentage of women veterans is expected to rise to nearly 18%. Learn more about your world at Learning Life: http://letlearninglive.org/.
Given the public’s ability to dodge much advertising at home using their remote controls, mouses, spam filters, recording devices and other tools, marketers are shifting more to what is called “out-of-home advertising” (OOHA). As the name indicates, OOHA is advertising that occurs outside the home, on digital or fixed-content billboards, posters and screens in or on subways, buses, stadiums, airports, gas stations, supermarkets, restaurants, and other locations.
According to the Outdoor Advertising Association of America (OAAA), OOHA currently comprises a very small portion of overall media ad spending (4% in 2012), compared with magazines (9%), radio (10%), newspapers (13%), cable TV (18%), broadcast TV (23%) and the internet (23%). Yet OOHA revenue has grown every year since 2009, rising to $6.7 billion in 2012 to become “the fastest growing local ad medium with 22% growth over the last decade,” per OAAA.
But not all OOHA is equal. Some OOHA surfaces can be more effective than others. Learning Life’s approach is predicated on the principle that it is easier to engage people when they are sitting or standing and gazing at things, whether this be standing in bathrooms, bus stops, or waiting lines, or sitting in restaurants, bars, cafes, laundromats, hair salons, trains or buses. Such situations are opportunities for incidental learning – unintended learning in everyday life, in contrast with the typically deliberate learning that happens in schools – connecting people to intriguing information and questions on topics of public import, leading to a world of learning, fun and reward online at Learning Life via website address or QR code they enter into their cell phones, tablets or laptops.
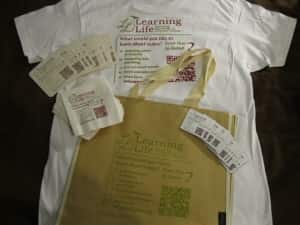
Prior research on the effectiveness of different OOHA surfaces is fairly scarce though, so Learning Life recently conducted its own first test. On one sunny Saturday afternoon in May, Learning Life staff distributed a small sample of 1,000 coasters and 1,000 napkins (see above photo; we did not distribute the fridge magnets featured at top left in the photo) in about a dozen restaurants, bars and cafes on two popular commercial streets of Alexandria, Virginia. We took care not to do anything else differently to help control for other factors that might account for the results we got.
Our results before (Friday) and after (Sat-Thurs) the napkin and coaster distribution were as follows:
Friday
Saturday
Sunday
Monday
Tuesday
Wedn
Thursday
Visitors
25
32
71
51
37
58
43
Pageviews
80
149
328
207
193
189
117
The chart shows a notable increase in the number of visitors and page views[1] comparing Friday, the day before we distributed the 2,000 coasters and napkins, and the several days after the distribution, especially Saturday through Wednesday. The number of visitors nearly tripled and the number of page views more than quadrupled from Friday to Sunday, declining thereafter. These increases are all the more notable because Learning Life’s website normally attracts fewer visitors and page views on weekends, when people are more likely to be out than at their computers.
If we count up the increased number of visitors and page views from Saturday through Thursday, subtracting 35 visitors and 125 page views for each day as an average of normal website traffic without the napkin and coaster distribution, we net 82 added visitors and 433 page views, or 1 visitor for every 24 napkins and coasters, and 1 page view for every 4.6 coasters and napkins.
This, of course, excludes the presumably much larger number of people who read the napkins’ and coasters’ imprinted invitation, but did not use their phones, tablets or laptops to go to Learning Life’s website. It is also worth noting that the napkins and coasters we distributed did not offer any incentives (e.g., rewards or discounts on consumer goods or services) to go to Learning Life’s website, as we expect future sponsored Learning Life surfaces will (for more, see my recent post titled “Sponsoring Learning Life”).
Learning Life’s website traffic grows every month, but is still very small, as these numbers indicate. The increases we document in this test though are encouraging for the use of everyday surfaces people sit or stand and gaze at to spur people to learn more.
[1] Visitors = the number of individuals or “unique visitors” who visited Learning Life’s website. Pageviews = the number of Learning Life website pages viewed. The number of pageviews is usually larger than the number of visitors since individuals often view two or more pages of a website.

 This fall semester, Kayla will be entering her junior year at George Washington University in Washington D.C., majoring in political science and minoring in development studies. At GW, Kayla has an impressive 3.75 GPA, and has been involved with The National Society of Collegiate Scholars, the College Democrats, and Students for Barack Obama. Upon graduating, Kayla aims to go to law school in order to pursue a career advocating for human rights internationally.