
DC Rich and Poor: A Tale of Two Wards
Like all cities worldwide, Washington DC is subdivided into smaller governmental units. In DC, these units are called wards, and the city has eight of them. Six of DC’s wards are located west of the Anacostia River (Wards 1-6), two east of the River (Wards 7 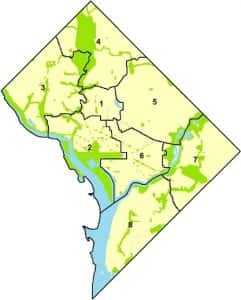 and 8). For all the gentrification happening throughout DC, the Anacostia River divides the city not just naturally, but economically and racially, clustering wealth disproportionately west of the River, and poverty east of the River, with sharply different consequences for the lives and prospects of DC’s inhabitants. To learn more about the conditions our lower-income Ward 8 families face as they participate in Learning Life’s Citizen Diplomacy Initiative, our research partner and Georgetown University Medical Center fellow, Dr. Melissa See, helped collect statistics comparing DC’s richest ward, Ward 3, and its poorest, Ward 8. Below are the arresting racial, economic and health facts she gathered, weaving a Dickensian “tale of two cities” separate and very unequal.
Notes: The numbers in brackets [ ] below refer to the sources of the data, which are linked at the bottom of this page. Percentages are rounded to the nearest one percent. Average family income is rounded to the nearest $1,000.
| WARD 3 | WARD 8 | |
| Ward Population 2015 [5] | 83,152 | 81,133 |
| Median Age 2015 [5] | 37 | 29 |
| % Children 2010 [2] | 13% | 30% |
| % Black 2015 [2] | 6% | 92% |
| % White, non-Hispanic 2015 [2] | 74% | 4% |
| % Foreign-Born 2011-2015 [2] | 19% | 3% |
| Median Household Income 2015 [5] | $113,000
|
$31,000 |
| % Unemployed 2011-2015 [2] | 4% | 23% |
| % of Population in Poverty 2011-5 [2] | 10% | 38% |
| % Children in Poverty 2011-5 [2] | 3% | 50% |
| # of Individuals on Food Stamps 2016 [2] | 378 | 41,561 |
| % without HS Diploma 2011-5 [2] | 2% | 17% |
| % with College Degree 2015 [5] | 86% | 14% |
| % Female-Headed Homes with Children 2011-5 [2] | 12% | 74% |
| % Low Birth Weight (under 5.5 lbs)
2011 [2] |
7.1% | 13% |
| % Birth to Teen Mothers 2011 [2] | 0% | 18% |
| Physically Inactive 2013 [3] | 10% | 34.5% |
| Not Tested for HIV 2013 [3] | 44.5% | 16.6% |
| # with Chlamydia Per 100,000 People
2013 [3] |
75 | 1,173 |
| % Current Smokers 2013 [3] | 7% | 41% |
| % Obese 2013 [3] | 12% | 42.8% |
| % Diabetes 2013 [3] | 3% | 16% |
| % Depressed 2013 [3] | 23.7% | 28% |
| % of Population with Emergency Dept Visits 2014 [3] | 5% | 17% |
| % of Adults w/o Health Insurance 2013
[3] |
4.8% | 7.6% |
| # of Grocery Stores 2016 [6] | 9 | 1 |
Sources and References
- District of Columbia Health Systems Plan 2017
- Neighborhood Info DC
- District of Columbia Community Health Needs Assessment 2016
- The Health of the African American Community in the District of Columbia: Disparities and Recommendations July 2016
- Census Reporter, Ward 3 DC, Ward 8 DC
- Wards 7 And 8 Have Three Grocery Stores For 149,750 People
- Closing the Grocery Store Gap in the Nation’s Capital