
A Test of Learning Life Surfaces
Given the public’s ability to dodge much advertising at home using their remote controls, mouses, spam filters, recording devices and other tools, marketers are shifting more to what is called “out-of-home advertising” (OOHA). As the name indicates, OOHA is advertising that occurs outside the home, on digital or fixed-content billboards, posters and screens in or on subways, buses, stadiums, airports, gas stations, supermarkets, restaurants, and other locations.
According to the Outdoor Advertising Association of America (OAAA), OOHA currently comprises a very small portion of overall media ad spending (4% in 2012), compared with magazines (9%), radio (10%), newspapers (13%), cable TV (18%), broadcast TV (23%) and the internet (23%). Yet OOHA revenue has grown every year since 2009, rising to $6.7 billion in 2012 to become “the fastest growing local ad medium with 22% growth over the last decade,” per OAAA.
 But not all OOHA is equal. Some OOHA surfaces can be more effective than others. Learning Life’s approach is predicated on the principle that it is easier to engage people when they are sitting or standing and gazing at things, whether this be standing in bathrooms, bus stops, or waiting lines, or sitting in restaurants, bars, cafes, laundromats, hair salons, trains or buses. Such situations are opportunities for incidental learning – unintended learning in everyday life, in contrast with the typically deliberate learning that happens in schools – connecting people to intriguing information and questions on topics of public import, leading to a world of learning, fun and reward online at Learning Life via website address or QR code they enter into their cell phones, tablets or laptops.
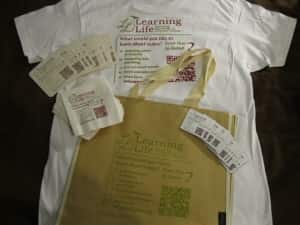
Prior research on the effectiveness of different OOHA surfaces is fairly scarce though, so Learning Life recently conducted its own first test. On one sunny Saturday afternoon in May, Learning Life staff distributed a small sample of 1,000 coasters and 1,000 napkins (see above photo; we did not distribute the fridge magnets featured at top left in the photo) in about a dozen restaurants, bars and cafes on two popular commercial streets of Alexandria, Virginia. We took care not to do anything else differently to help control for other factors that might account for the results we got.
Our results before (Friday) and after (Sat-Thurs) the napkin and coaster distribution were as follows:
| Friday | Saturday | Sunday | Monday | Tuesday | Wedn | Thursday | |
| Visitors |
25 |
32 |
71 |
51 |
37 |
58 |
43 |
| Pageviews |
80 |
149 |
328 |
207 |
193 |
189 |
117 |
The chart shows a notable increase in the number of visitors and page views[1] comparing Friday, the day before we distributed the 2,000 coasters and napkins, and the several days after the distribution, especially Saturday through Wednesday. The number of visitors nearly tripled and the number of page views more than quadrupled from Friday to Sunday, declining thereafter. These increases are all the more notable because Learning Life’s website normally attracts fewer visitors and page views on weekends, when people are more likely to be out than at their computers.
If we count up the increased number of visitors and page views from Saturday through Thursday, subtracting 35 visitors and 125 page views for each day as an average of normal website traffic without the napkin and coaster distribution, we net 82 added visitors and 433 page views, or 1 visitor for every 24 napkins and coasters, and 1 page view for every 4.6 coasters and napkins.
This, of course, excludes the presumably much larger number of people who read the napkins’ and coasters’ imprinted invitation, but did not use their phones, tablets or laptops to go to Learning Life’s website. It is also worth noting that the napkins and coasters we distributed did not offer any incentives (e.g., rewards or discounts on consumer goods or services) to go to Learning Life’s website, as we expect future sponsored Learning Life surfaces will (for more, see my recent post titled “Sponsoring Learning Life”).
Learning Life’s website traffic grows every month, but is still very small, as these numbers indicate. The increases we document in this test though are encouraging for the use of everyday surfaces people sit or stand and gaze at to spur people to learn more.
Paul Lachelier, Ph.D. Founder, Learning Life
[1] Visitors = the number of individuals or “unique visitors” who visited Learning Life’s website. Pageviews = the number of Learning Life website pages viewed. The number of pageviews is usually larger than the number of visitors since individuals often view two or more pages of a website.